A slope and y intercept worksheet is a focused way to practice reading linear relationships and spotting the two most important parts of a line. The best worksheets keep the task clear: identify slope, identify the y-intercept, and explain how each appears in an equation, graph, or table. This makes the practice feel direct and classroom-friendly, with just enough structure for students to build confidence.
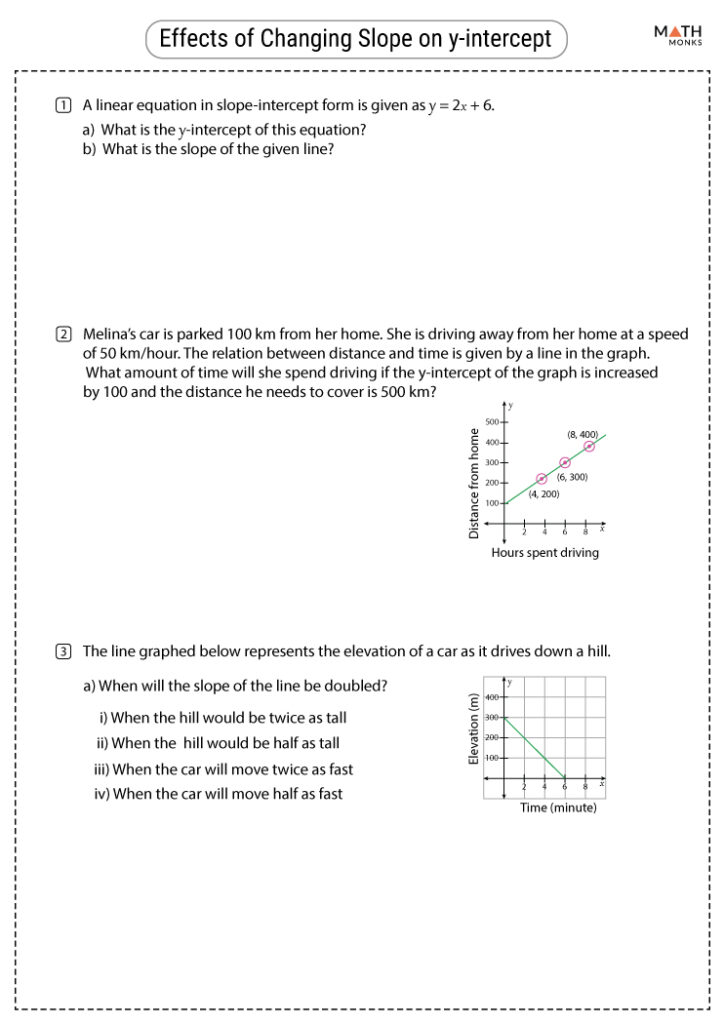
What the practice targets
The main skill on a slope and y intercept worksheet is recognizing slope-intercept form and pulling out the slope and y-intercept from what students see. In an equation like y = 3x – 2, the slope is 3 and the y-intercept is -2. In a graph, students should find where the line crosses the y-axis and then describe the rise-over-run pattern. In a table, they can look for a constant rate of change and the starting value when x = 0.
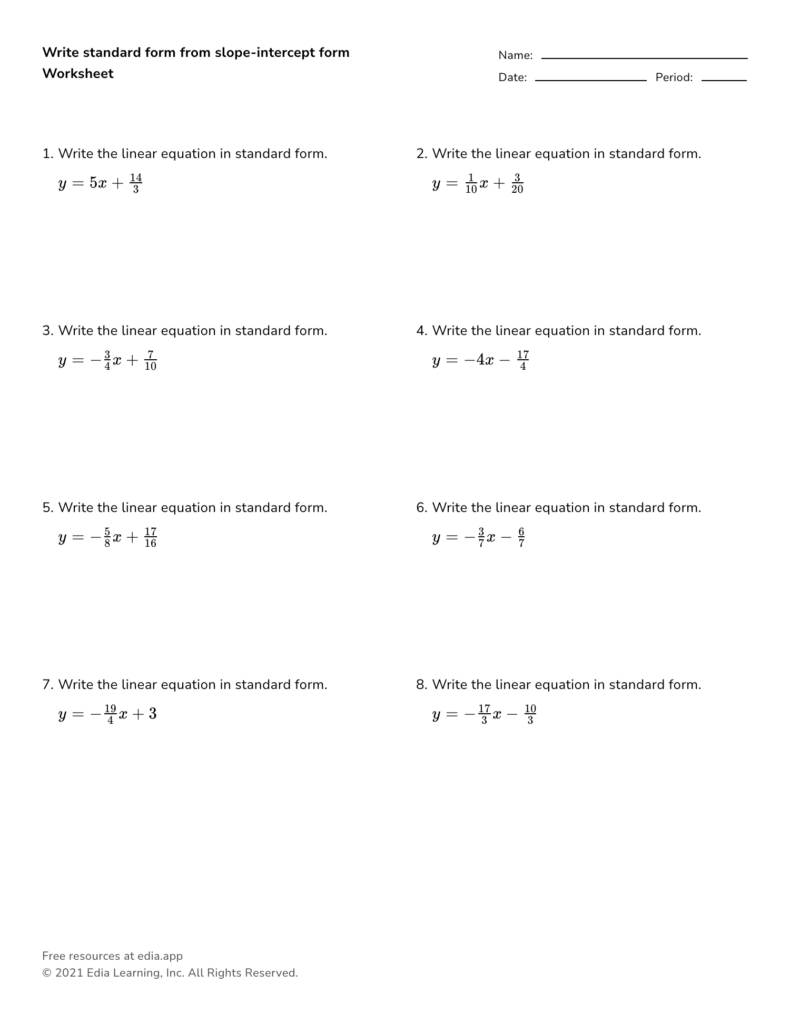
Worksheet exercise types
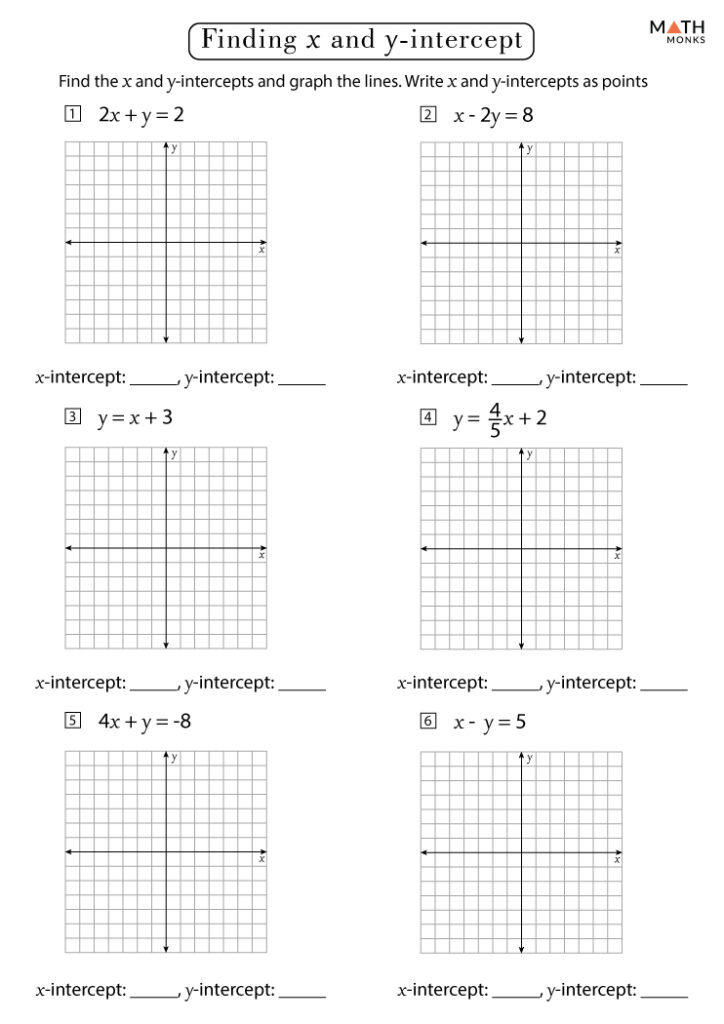

A strong worksheet usually mixes equations, graphs, and tables so students practice the same idea in different formats. Equation items help them read slope-intercept form directly. Graph items ask them to point out the intercept and estimate slope from two points on the line. Table items are useful for connecting patterns to numbers, especially when the y-intercept appears as the value in the row where x equals zero. Variety keeps the practice focused without making it feel repetitive.
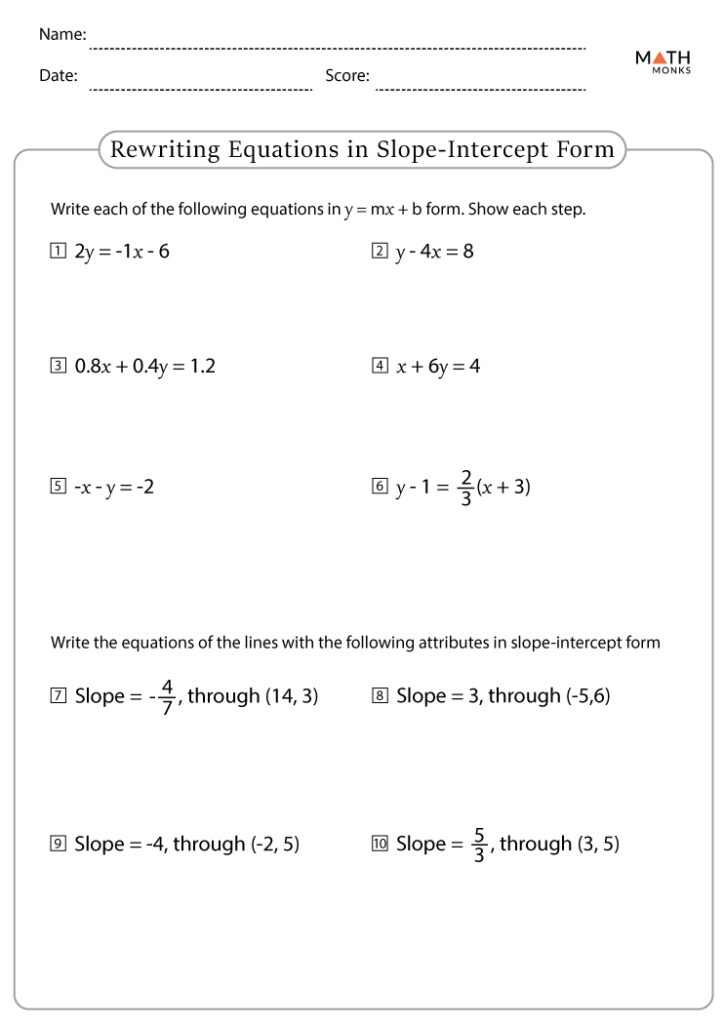
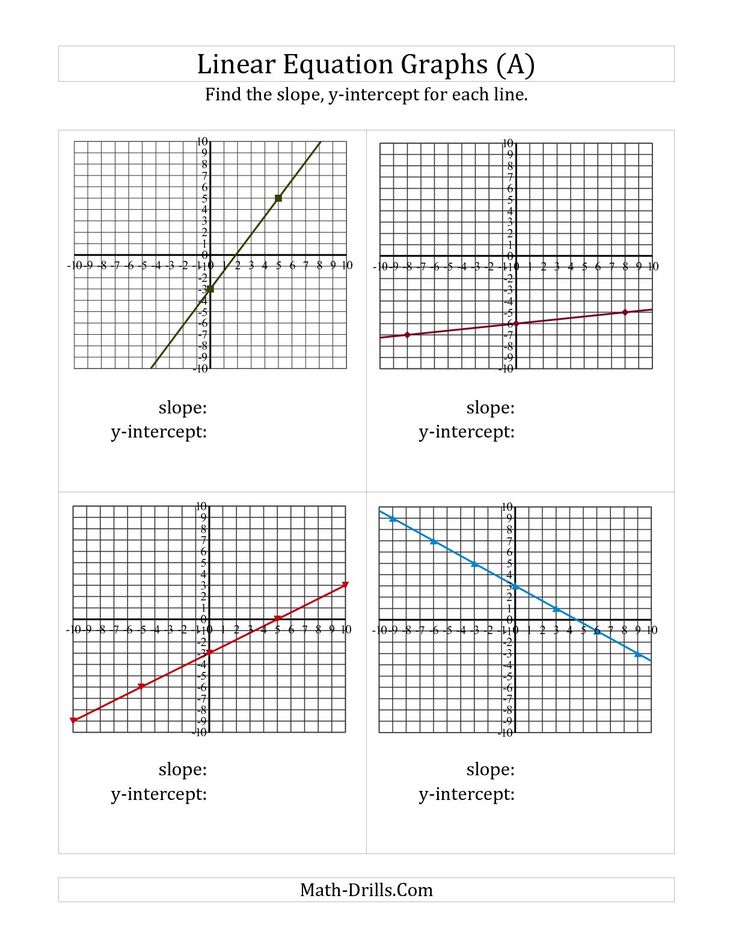
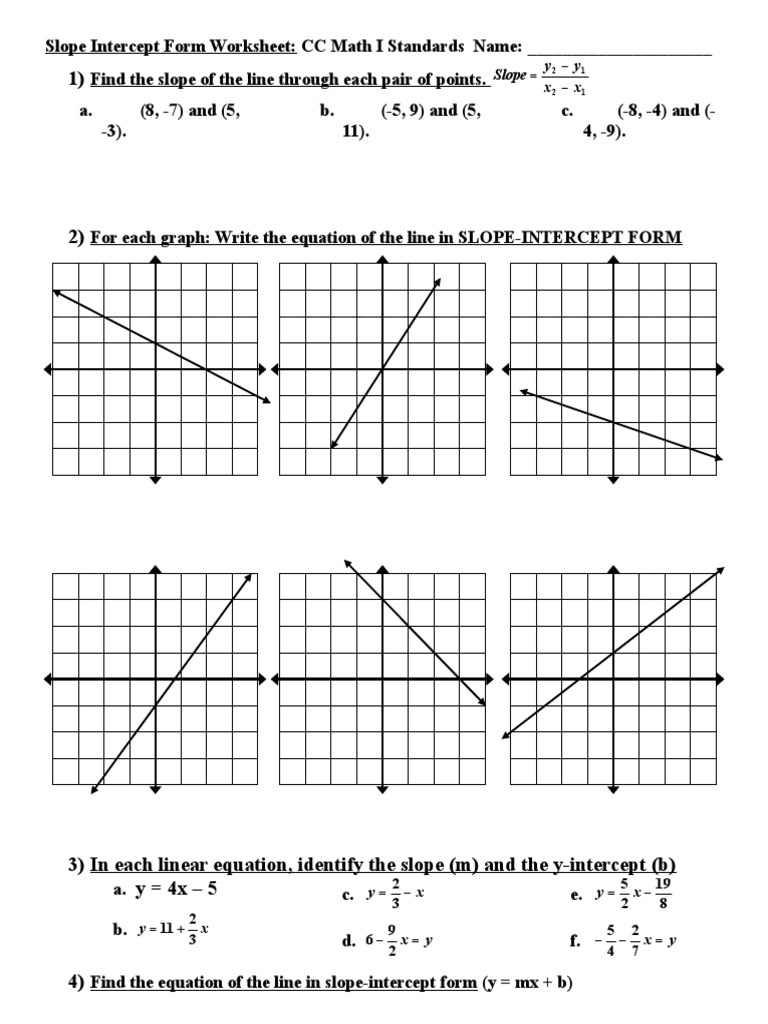
For self-checking, the worksheet should include either a complete answer key or problems written so the answers can be verified clearly. That matters because students need to know whether they identified the correct slope and y-intercept, not just whether they finished the page. Worksheets for this skill work especially well for middle school or early algebra students, since the focus stays on one core interpretation skill. Used well, the page becomes a quick review tool before quizzes or a useful homework check.